Coral Gables had a phenomenal 2014 for real estate sales. There were 520 closed sales from January 1, 2014 through December 31, 2014 and 218 of those were cash sales. The highest priced sale for the year was for a 21,000 square foot, waterfront home in Tahiti Beach, listed by One Sotheby’s Saddy Delgado and sold by Irina Artemova of Luxe Living Realty for $18,000,000. Both the number of closed sales and the number of cash sales were down from 2013, which reported 607 closed sales, 224 of which were cash, but the percentage of cash sales was higher in 2014 at almost 42% of all transactions.
Now that we are in the second week of 2015, almost all of the Pinecrest real estate sales for 2014 have been recorded in the MLS. There were 246 closed sales reported with a high sales price of $5.5 million for a stunning 12,000 square foot home on 60 Avenue, listed and sold by One Sotheby’s Saddy Delgado. Though slightly down from 2013’s level of 253 closed sales, 2014 was a great year to be a seller in Pinecrest! Almost 39 percent of the homes sold this year were cash sales compared to 30.4 percent of 2013’s sales.
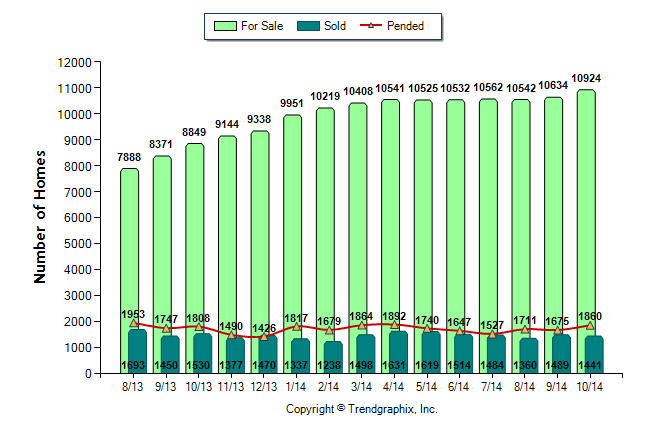
Spurred by downsizing baby boomers and other age groups wanting to be close to dynamic urban cores, the market share of condo sales has increased nationwide from 8% to 11-12%, according to Lawrence Yun, Chief Economist for the National Association of Realtors . In Miami, that number is closer to 45% of home sales in September. Although the level of inventory increased from September to October, so did the number of units that went pending and we are getting into our busy winter selling season. Based on our current level of condos listed on the MLS, we are still in a stable market with 6-8 months of inventory. What would help move the market would be an easing of financing restrictions so that Millennials and first time buyers could get into the market.
Although today’s Miami Herald article “Housing market shows signs of cooling” may send some buyers back to the sidelines, it should be emphasized that they are referring to the condo market. Here is a snapshot of what EWM’s Coral Gables office saw in activity this week:
New Sales Listings: 15, 6 condos and 9 single family homes, 6 listings above $1 million.
New Rental Listings: 12, 7 condos and 5 single family homes
Residential Sales: 34, 7 condos and 27 single family homes, 3 were above $1 million.
To break what is going on with our sales into percentages, we saw 44% more sales than new listings. Of the 7 condos that sold, one was sold above asking price and another was sold at asking price. The numbers were even more impressive for the single family homes with over 38% of them selling at or above list price (26.47% selling at and almost 12% over).
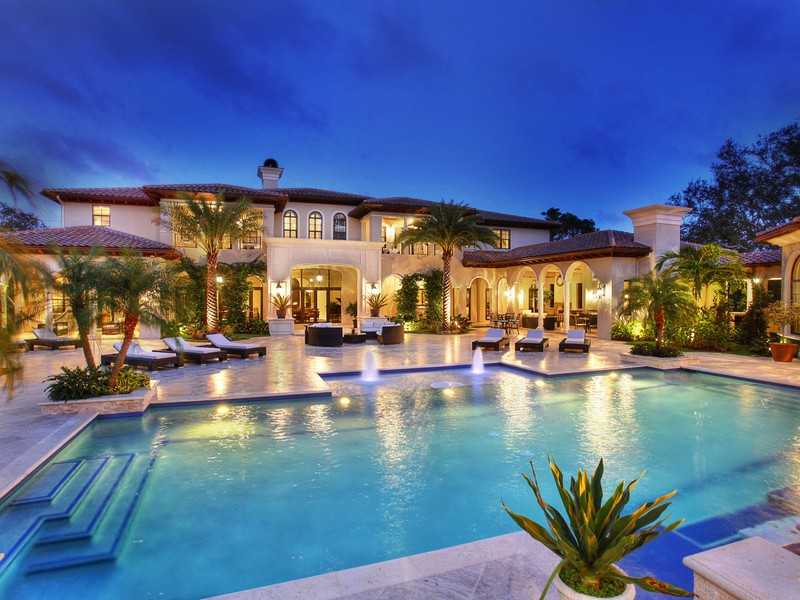
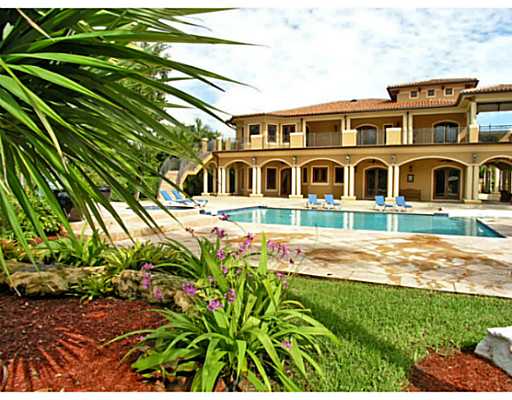
So what does this mean if you are a seller? If your house or condo is priced right and is in a location with tight inventory, such as the house pictured above listed by EWM’s Carole Smith, it will sell. Now is a great time to list, before inventory in your neighborhood rises.
What does it mean if you are a buyer? If you are looking for a home in a neighborhood with a tight inventory, make sure you are aware of the most recent sales so you know what to offer. If you are interested in a home with a lot of inventory, or with a significant increase in inventory projected, do the numbers to get a good price.
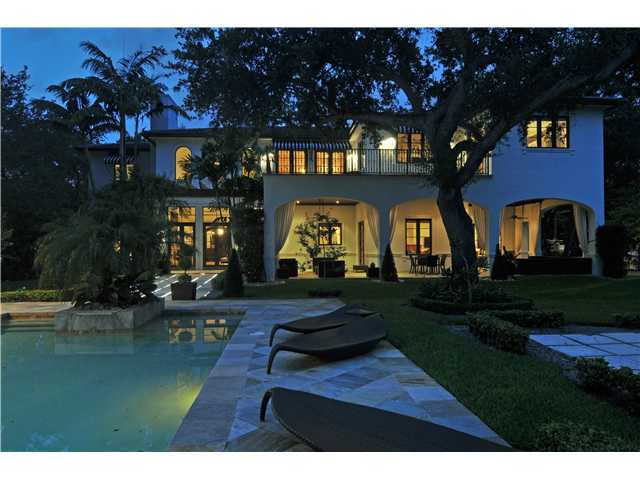
November was a busy month in Pinecrest. There are currently 127 listings on the market, 18 of which were added to the MLS in November. There are a total of 42 listings under contract, 12 that went pending in November. 14 properties closed in November out of a total 227 sales to date for 2013. The highest sale for November is pictured above. It closed for $3.175 million. Coldwell Banker was the listing broker and EWM was the selling broker.
The highest priced sale so far this year was 6500 SW 98 Street, which was listed by the Campins Group and sold by Shelton and Associates.
Penthouse at the Gables Club – Listed by Allison Blumenthal, Avatar Real Estate
Our office had another incredible week, with a total of $50,208,640 in real estate sales. The bulk of that was for a vacant 1.74 acre lot at 301 SW 8 Street. It closed for $20 million. We also had several residential sales over $3 million. Overall, the number of sales were twice as many as new listings. We had 30 residential sales and only 15 new residential listings, further evidence that inventory is still tightening. Demand is high from buyers, and sellers are less likely to list going into the holiday seasons.
If you are planning on selling in 2014, consider putting your home on the market now, while the inventory is low. You will beat the rush of sellers that list their homes in the first part of the year.
Another banner week at EWM, with our Coral Gables office sales for the week totaling over $23,000,000 and our Miami Beach office totaling over $12,000,000!
EWM’s Gables office had 24 sales, with 7 going at or above asking, and 23 new listings, 6 of which are foreclosures.
Sales are going strong due to a still- limited inventory and strong demand from buyers trying to get into the market.
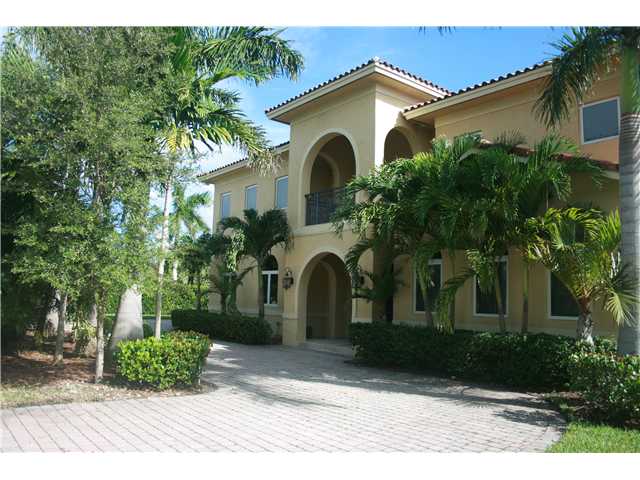
Pinecrest Home Sold By EWM agents Valerie Byrne (listing agent) and Monica Betancourt (selling agent)
We are already half way through October and almost at the end of the year. 2013 will probably break another record in terms of the number of real estate sales we have had in Miami-Dade County. A quick snapshot of the Pinecrest real estate market shows the following:
205 single family homes have closed since January 1, 2013. 12 were short sales, 4 were bank-owned
47 of the closed sales were between $1 million and 1.999.999. 25 were over $2 million. Highest sale to date this year was for $3.8 million.
42 single family homes are under contract, over half are distressed sales. 21 are short sales and 2 are bank-owned
out of the 42 pending sales, only 15 are listed for over $1 million, none are listed over $2 million
127 single family homes currently listed for sale, 5 of which are short sales and one is a bank-owned property
90 of the homes that are currently listed are over $1 million, 42 are listed over $2 million
Since October 1, there have been 11 new listings, 2 of which are short sales, and 2 homes have gone under contract. So far, there have been no closed sales in October. Going forward, I expect the inventory to increase slightly until Spring, at which point I think we will see more inventory come on the market. I still expect properties priced from $600,000 – $1 million to move fairly quickly.
If you are a buyer, especially in the luxury price range, you will have a lot to choose from and have more negotiating room.
If you are a seller, you will want to price your property so that it sells before the inventory increases in the Spring.
These numbers include all of the listings posted in the MLS through August. A search of the MLS for September shows 24 new listings in Pinecrest ranging from $599,000 up to $3.9 million, no closed sales, and 8 pending sales.